
Every 'best tools for restaurants' list is the same handful of names someone happens to like, with no way to tell whether real restaurants use any of them. So we checked directly. Full disclosure first: this is built on Stackra's own data, and we sell a website audit, so weigh the one suggestion at the end with that in mind. Everything before it is just the numbers.
Our corpus covers 137,970 verified US restaurant websites. The US numbers come from our own extended-signal detection, run across every one of those sites, so we can see what restaurants actually install instead of what gets the most marketing budget. We cross-check it against public web-scale datasets: Common Crawl for the page inventory, the HTTP Archive for technology adoption (and for the worldwide figures, where it is our source), and the Chrome UX Report for real-world performance. Every US figure is the 2026 vintage. Detection can miss fully custom builds, so read each share as a floor, not a ceiling.
The stack almost every restaurant shares
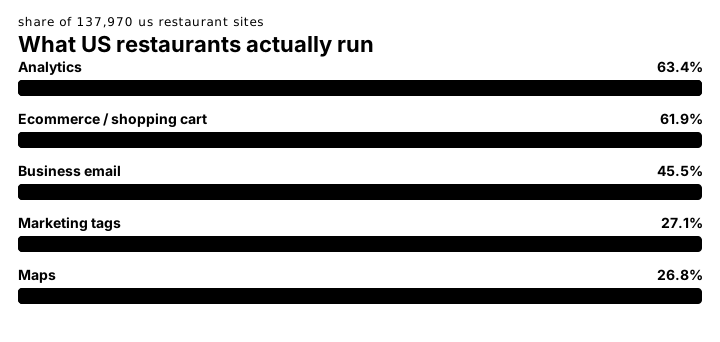
Three things show up on most restaurant sites. Analytics leads at 63.4%, almost always Google Analytics. A general-purpose shopping cart follows at 61.9%: Squarespace Commerce (14.0%), Wix eCommerce (8.1%), WooCommerce (3.6%), and Square Online (3.1%). Read that as commerce capability, not a food-ordering flow. On a restaurant site a generic cart usually powers gift cards or merch; the dedicated ordering and reservation platforms are a separate thing, and we measure them next. A business email service sits at 45.5%, usually Google Workspace or Microsoft 365, and marketing tags round it out at 27.1%, led by Google Tag Manager. Each share is the percentage of all 137,970 sites.
| Category | Share | Most common |
|---|---|---|
| Analytics | 63.4% | Google Analytics |
| Ecommerce / shopping cart (any) | 61.9% | Squarespace Commerce, Wix eCommerce, WooCommerce, Square |
| Business email | 45.5% | Google Workspace, Microsoft 365 |
| Marketing tags | 27.1% | Google Tag Manager, SpotHopper, Mailchimp |
| Maps | 26.8% | Google Maps |
'Ecommerce / shopping cart' means a general-purpose cart is present, which on a restaurant site is often gift cards or merch, not necessarily food ordering (measured separately below). Share = percentage of all 137,970 US restaurant sites. Source: Stackra corpus, US, 2026.
How restaurants actually take orders and bookings
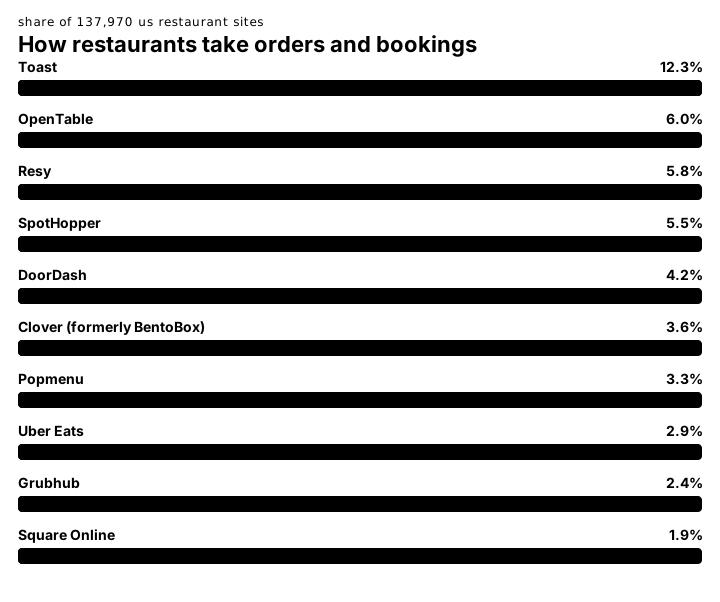
Dedicated ordering and reservation platforms are their own category, separate from the generic cart above, and most 'best restaurant tools' lists get the ranking wrong. 34.3% of restaurant sites run at least one, so a purpose-built ordering or booking flow is closer to table stakes than a differentiator. Toast leads at 12.3%, more than double the next name. OpenTable (6.0%), Resy (5.8%), and SpotHopper (5.5%) follow, and the delivery marketplaces are a real ordering channel too: DoorDash 4.2%, Uber Eats 2.9%, Grubhub 2.4%. Split by job, 27.7% of restaurants run a first-party ordering platform, 11.0% a reservation system, and 5.8% a delivery marketplace. If you are weighing the reservation options specifically, we broke those down in our restaurant reservation software data.
| Platform | What it is | Type | Share |
|---|---|---|---|
| Toast | POS with online ordering | Ordering | 12.3% |
| OpenTable | Table reservations | Reservations | 6.0% |
| Resy | Table reservations | Reservations | 5.8% |
| SpotHopper | Restaurant website builder plus ordering and marketing | Website + ordering | 5.5% |
| DoorDash | Third-party delivery marketplace | Delivery | 4.2% |
| Clover (formerly BentoBox) | Restaurant website builder with online ordering | Website + ordering | 3.6% |
| Popmenu | Restaurant websites, menus, and marketing | Website + ordering | 3.3% |
| Uber Eats | Third-party delivery marketplace | Delivery | 2.9% |
| Grubhub | Third-party delivery marketplace | Delivery | 2.4% |
| Square Online | Online ordering and store | Ordering | 1.9% |
| Slice | Online ordering, built for pizzerias | Ordering | 1.9% |
| ChowNow | Commission-free online ordering | Ordering | 1.5% |
| Menufy | Online ordering for independents | Ordering | 1.4% |
| FoodBooking | Free ordering and reservation widget | Ordering | 0.9% |
| GloriaFood | Free online ordering, big outside the US | Ordering | 0.8% |
| SevenRooms | Reservations and guest data for upscale venues | Reservations | 0.5% |
Share = percentage of all 137,970 US restaurant sites that use each platform. Read the smaller and delivery-marketplace names as at-least figures. Source: Stackra corpus, US restaurants, 2026.
The biggest gap: reviews
Just 1.7% of restaurant sites run any on-site review tool, and Trustindex leads the few that do. For a business where the decision is driven by social proof, that is the clearest gap in the data. The reviews already exist on Google and Yelp; almost no restaurant surfaces them on the page where the booking actually happens. It is the same pattern we found across service industries in our review management software data, and it maps straight to where sites quietly lose leads.
How restaurant sites perform
Restaurants do well on speed. 73.7% pass Google's Core Web Vitals and the median largest-contentful-paint is 1.3 seconds, comfortably inside the 2.5 second target and better than most industries we measure. The likely reason is that so many restaurants run on managed platforms that handle performance for them. These figures come from field data in the Chrome UX Report, not a one-off lab test.
What this means for your site
Analytics, business email, and an ordering layer are the baseline. If you are missing one, you are behind the median restaurant. The room to stand out is in booking and reviews, the two things that turn a visitor into a covered table.
- •Baseline you should already have: analytics, business email, and an online ordering or commerce layer.
- •Differentiators most restaurants skip: a dedicated reservation or ordering platform (only 13.8% run one) and on-site reviews (only 1.7%).
- •For a website-first platform, Bentobox and Popmenu are the most common; for reservations, OpenTable and Resy; for simple online ordering, Slice, or the free tools GloriaFood and FoodBooking.
This is one slice of a bigger picture. For the same breakdown across other business types, see how tool stacks differ by industry.